The histograms I generated helped people understand what the sample plots were showing, but they didn't really help me understand what was ultimately going on. For instance, it is clear that some of the histograms were bimodal or multimodal, but it wasn't clear what caused the different modes. I poked around at some of the data to see what caused some of the weirdness, and I found that some of the identifiable items were caused by misbehaving or misconfigured machines, or by machines that were being used for experiments. I didn't want to do this by hand, though, because it was rather time-intensive. I wanted to write a program that could automatically determine if a machine wasn't working correctly. It was clear that the machine with the load of 180 wasn't working right, but some of the other problem machines had much more subtle issues.
I tried creating some scatter plots of things that
ought to be roughly correlated, but I was disappointed to see that nothing obvious stood out. Since I was using a computer, though, I decided to simply create scatter plots of every variable against every other variable. This gave me a couple hundred plots. Most of them were uninteresting. If two variables are exactly correlated, the plot is simply a line. If they are completely uncorrelated, the plot is a blob. But if the variables are loosely correlated, or if the correlation depends upon the correct functioning of the machine, you end up with a scatter plot with unusual and distinctive features. One of these caught my eye:
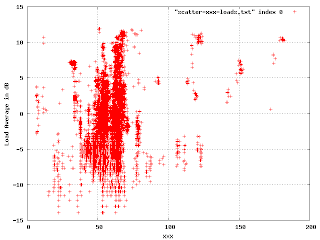
In this, we're plotting the load average (in dB) against a shared resource. The points outside the big blob are of interest. Where there is a cluster of points, like at (40, 7), I found that it was a single machine that was misconfigured in some particular way. The correctly working machines produced this part of the plot:
There is an obvious multi-modal distribution here that would have been difficult to see by plotting just one or the other variable.
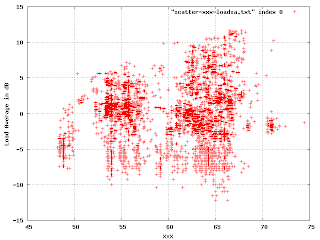
 In this, we're plotting the load average (in dB) against a shared resource. The points outside the big blob are of interest. Where there is a cluster of points, like at (40, 7), I found that it was a single machine that was misconfigured in some particular way. The correctly working machines produced this part of the plot:
 There is an obvious multi-modal distribution here that would have been difficult to see by plotting just one or the other variable.
No comments:
Post a Comment