Wednesday, July 25, 2007
From Histograms to Scatter Plots
The histograms I generated helped people understand what the sample plots were showing, but they didn't really help me understand what was ultimately going on. For instance, it is clear that some of the histograms were bimodal or multimodal, but it wasn't clear what caused the different modes. I poked around at some of the data to see what caused some of the weirdness, and I found that some of the identifiable items were caused by misbehaving or misconfigured machines, or by machines that were being used for experiments. I didn't want to do this by hand, though, because it was rather time-intensive. I wanted to write a program that could automatically determine if a machine wasn't working correctly. It was clear that the machine with the load of 180 wasn't working right, but some of the other problem machines had much more subtle issues.
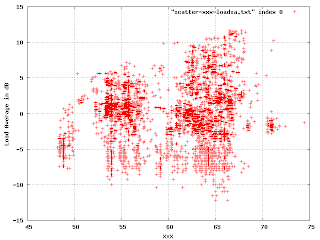
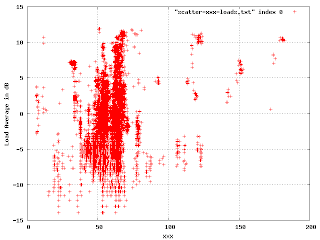
I tried creating some scatter plots of things that ought to be roughly correlated, but I was disappointed to see that nothing obvious stood out. Since I was using a computer, though, I decided to simply create scatter plots of every variable against every other variable. This gave me a couple hundred plots. Most of them were uninteresting. If two variables are exactly correlated, the plot is simply a line. If they are completely uncorrelated, the plot is a blob. But if the variables are loosely correlated, or if the correlation depends upon the correct functioning of the machine, you end up with a scatter plot with unusual and distinctive features. One of these caught my eye:
In this, we're plotting the load average (in dB) against a shared resource. The points outside the big blob are of interest. Where there is a cluster of points, like at (40, 7), I found that it was a single machine that was misconfigured in some particular way. The correctly working machines produced this part of the plot:
There is an obvious multi-modal distribution here that would have been difficult to see by plotting just one or the other variable.
Where's the Lisp?
The first few graphs I made just by futzing around with Emacs and gnuplot. When I had to more processing by smoothing histograms and such I decided to use Scheme to manipulate the data. When I started thinking I had to convolve the data with gaussians I decided that I should use MIT Scheme because it has a pretty good compiler.
The script that probes the machines was written in Scsh, and I made sure to emit the samples in a trivially readable format.
Scheme has been great for experimenting with this. I've written a fair amount of ad-hoc code for generating the data for gnuplot, and most of the resulting graphs are uninformative. When I find some presentation that does show something of interest, I just replace the specific literals with variables and wrap a lambda around it.
I only mention this because I was surprised at how easy it was to transition from a small collection of random fragments of code to a simple toolkit by mixing and matching higher-order abstractions and by noticing common patterns. It is completely undisciplined programming, but very powerful.
More Graphs
Although the graph of loads in decibels has some interesting features, I couldn't figure out how to correlate the bands in the graph to some meaningful fact about the machines. I tried plotting the load average against other quantities I had measured, but there was no obvious reason for what I was seeing. In desperation, I tried a few off-the-wall ideas. One was to sort the samples lexicographically by operating system version. This is the resulting graph:
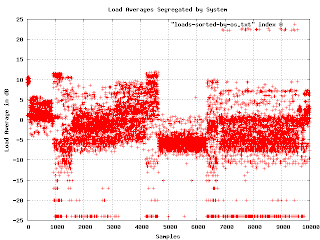
Now I was getting somewhere. It seems that the load averages are strongly affected by the underlying operating system. On one level, this isn't surprising, but since the various OS are supposed to be very similar, I expected much less variation. Apparently OS selection is much more important than I thought.
I found a problem with this graph. When I showed it to people, they wanted to know what the X axis is (it isn't much of anything in this graph except that each data point has a different value for X). Lexicographical ordering of the OS isn't really related to the linear axis other than for grouping purposes. The important feature is that different OSs have different bands of density in the sample space. What I really needed was to separate the graphs and plot the density as a histogram. This turns out to be a lot easier said than done.
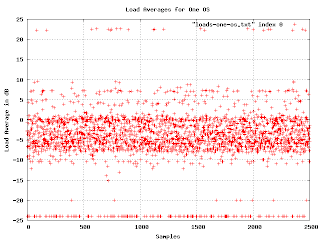
Here are the load averages for one particular OS (the one that occupies the range from 7000 to 9500 in the earlier graph). You can just make out two density bands. What we want is a simple histogram of the density as it changes when we go from the bottom to the top of the graph. No problem:
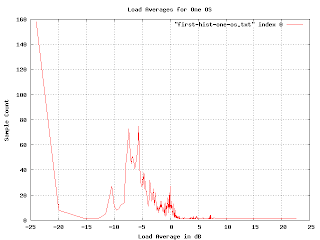
But something is wrong here. There are some bumps in the graph where you would expect, but the sizes are wrong. The peak for the loads at -5dB is much bigger than the one at 0dB, but the density of points at -5db doesn't seem much higher than that at 0dB. And shouldn't there be a blip up at 23dB?
Since we are using the logarithm of the load average, the buckets for the histogram are non uniform (in fact, they are exponentially decreasing in size). We can fix this by multiplying by a normalization factor that increases exponentially.
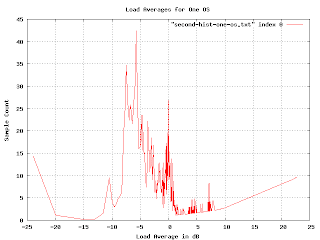
This is more realistic, but the exponential multiplication gives some weird artifacts as we approach the right-hand side. Since we know that load averages won't normally exceed 13dB, we really want to just look at the middle of the graph.
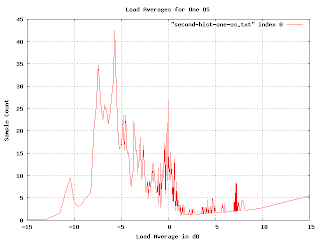
The problem we are encountering here is that graph is far too jagged as we approach the right-hand side. This is because the buckets are getting very fine-grained as the load gets higher. We want to smooth the histogram, but we want the smoothing to encompass more and more buckets as we reach the higher loads. I spent a couple of days trying to figure out how to convolve this graph with a continuously varying gaussian curve. I actually got somewhere with that, but it was really hard and very slow (you have to do a lot of numeric integration). Raph Levien suggest punting on this approach and just plotting the accumulated loads. I tried this, but for this particular problem it doesn't give the information I wanted. (I mention this because the idea turns out to be applicable elsewhere.)
Over the weekend I had an insight that in retrospect seems obvious. I guess I was so stuck in the approach I was working on that I didn't see it. (The seductive thing about my approach is that I was making progress, it just was getting to the point of diminishing returns). The buckets are hard to deal with because they vary in size. They vary in size because I took the logarithm of the load. If I simply perform the accumulation and smoothing before taking the logarithm all the problems go away. (Well, most of them, I still need to vary the smoothing, but now I can vary it linearly rather than exponentially and I can use addition rather than convolution). Here is what the graph looks like when you do it right:
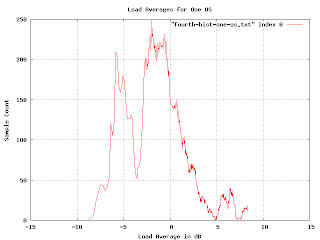
In order to check if I was doing it right, I generated some fake data with varying features (uniform distributions, drop-outs, gaussians, etc.) and made sure the resulting histogram was what I expected. I'm pretty confident that this histogram is a reasonably accurate plot of the distribution of load averages for the system in question.
(more later...)
Some Graphs, Maybe
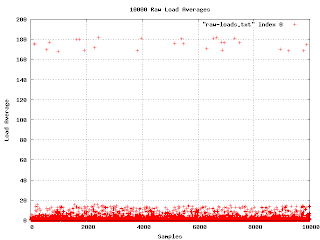
Arthur Gleckler suggested that I put up some graphs to illustrate the data analysis I was talking about earlier. I've decided to give it a try. Here are the raw load averages collected from a whole bunch of machines.
What do you know? It worked!
This is the first graph I made from the data I've collected. I wasn't really expecting much, but there are a few things to notice: first, there is a really unhappy machine with a load average in the 170 range. Second, my scanning program does not poll at regular intervals.
The unhappy machine turned out to be missing an important library. Unfortunately, the software reacted to this problem by spawning a process that itself depended on the library. When I checked, the machine had several thousand failing processes.
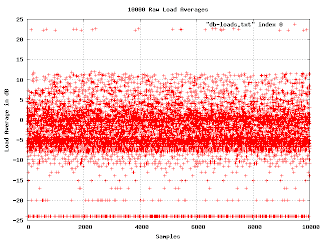
Other than those two facts, the graph isn't very informative. Everything is squeezed down into the bottom. But watch what happens when I convert the load average to decibels.
Now things start to get interesting. In the middle of the graph are two bands of higher density. This indicates a bimodal distribution of loads. It would be good to find out what causes that. Another thing to notice is that if we ignore the misconfigured machine, the graph has a fairly sharp upper edge at about 13dB. We can say that if the machine load ever gets above 13dB, it is clearly in trouble.
At the bottom of the graph the load averages fall into discrete lines. This is an artifact of the way loads are reported. They are rounded to the nearest hundredth, and when we show them in log scale, the rounding becomes obvious at the bottom of the graph.
(more soon...)
Thursday, July 19, 2007
An Unorthodox Idea: Measure Computer Performance in dB
I promised some unorthodox ideas, so here's one.
When I was at Northeastern University I would frequently suggest that people report the logarithms of the benchmarks they ran. I mentioned that a side benefit was that it would make you feel like a "real" engineer. Will Clinger said that a real engineer would be using decibels. I of course immediately converted my latest benchmarks to dB.
I was just taking things to the absurd limit, but I noticed something remarkable: the dB values were exceptionally easy to understand.
Human senses tend to work logarithmically. This allows people to sense a very wide range of sounds, light intensities, vibrations, etc. As it happens, the decibel is a particularly convenient unit for measuring things that people sense. For a large variety of phenomena, a 1 dB change is the `just noticable difference'. A 3dB change is almost exactly a factor of 2, and every 10dB is another order of magnitude. It's pretty easy to get the hang of it.
To give an example, let's convert the benchmark times from the previous post to dB:
C gcc 7.6 D Digital Mars 8.2 Clean 8.3 Lisp SBCL #2 8.6 Oberon-2 OO2C 8.7 Pascal Free Pascal #3 8.8 D Digital Mars #2 8.9 OCaml 9.1 Eiffel SmartEiffel 9.1 Ada 95 GNAT 9.9 C++ g++ 10.0 Nice 11.4 Java 6 -server 11.7 Scala #2 11.7 CAL 12.3 BASIC FreeBASIC #2 12.3 SML MLton 12.5 Haskell GHC #2 12.6 C# Mono 12.8 Fortran G95 13.6 Forth bigForth 13.9 Haskell GHC 18.4 Smalltalk VisualWorks 19.3 Erlang HiPE 19.9 Erlang HiPE #2 19.9 Scheme MzScheme 21.5 Scala 24.8 Haskell GHC #3 26.5 Lua #3 27.7 Pike 27.8 Python 28.1 Mozart/Oz #2 28.7 Perl #2 29.6 PHP 30.7 Tcl #2 31.6 Ruby 32.5
.
So what can we see? SBCL is just a tad slower than C gcc, but it is a tad faster than C++ g++. Scheme MzScheme is an order of magnitude slower than C++, but Perl is yet another order of magnitude slower. Between MzScheme and Scala you lose a factor of 2. There are other things you can do with dB, for example, you can measure compiler performance. A Scheme compiler that improves performance by, say, 12dB would move the Scheme runtime up near the Ada one. You might decide that a compiler tweak that improves performance by less than 1dB probably isn't worth it. Try converting some of your own performance numbers to dB and see what you think.Reporting Performance
I've seen a lot of different ways of reporting performance benchmark results. The most popular way seems to be simply listing the elapsed running time. Sometimes there is a bar chart or graph. Every now and then the relative speed is reported against some baseline. There are some oddballs that report benchmark times in Hertz.
All of these methods suffer from the same problem: the relative performance is not scale-free. Suppose you ran a benchmark on four different machines. Machine A takes 1.2 seconds, machine B takes 2.4 seconds, machine C takes 60.1 seconds, and machine D takes 80.7 seconds. Machine A is clearly winner coming in twice as fast as the next entry. But although machine C beats out machine D by a full 20 seconds, it isn't twice as fast as D. B would have to double to catch up with A, but D only needs to run 25% faster to catch up with C. If you plot these results on a graph or bar chart, you'd see that gap between D and C is much larger than the gap between B and A, but large gaps are to be expected when the time scale is larger.
This problem is easy to fix. Simply take the logarithm of the run time. In the example above, the log times for A, B, C, and D are 0.18, 0.88, 4.10, and 4.39 respectively. Now A and B differ by .7 while C and D differ by .29 It is obvious that C is closer to D than B is to A.
To give a real-life example, I grabbed the results of the fannkuch benchmark from the Computer Language Shootout. First, the timings as reported in the shootout:
C gcc 5.82 D Digital Mars 6.57 Clean 6.78 Lisp SBCL #2 7.20 Oberon-2 OO2C 7.39 Pascal Free Pascal #3 7.60 D Digital Mars #2 7.80 OCaml 8.06 Eiffel SmartEiffel 8.22 Ada 95 GNAT 9.78 C++ g++ 9.95 Nice 13.89 Java 6 -server 14.63 Scala #2 14.67 CAL 16.93 BASIC FreeBASIC #2 17.15 SML MLton 17.93 Haskell GHC #2 18.32 C# Mono 18.85 Fortran G95 23.02 Forth bigForth 24.46 Haskell GHC 69.09 Smalltalk VisualWorks 84.80 Erlang HiPE 97.60 Erlang HiPE #2 98.30 Scheme MzScheme 139.75 Scala 299.77 Haskell GHC #3 441.82 Lua #3 582.46 Pike 598.58 Python 641.36 Mozart/Oz #2 739.06 Perl #2 906.29 PHP 1165.02 Tcl #2 1456.69 Ruby 1786.76
.
Now the timings in log scale:C gcc 1.76 D Digital Mars 1.88 Clean 1.91 Lisp SBCL #2 1.97 Oberon-2 OO2C 2.00 Pascal Free Pascal #3 2.03 D Digital Mars #2 2.05 OCaml 2.09 Eiffel SmartEiffel 2.11 Ada 95 GNAT 2.28 C++ g++ 2.30 Nice 2.63 Java 6 -server 2.68 Scala #2 2.69 CAL 2.83 BASIC FreeBASIC #2 2.84 SML MLton 2.89 Haskell GHC #2 2.91 C# Mono 2.94 Fortran G95 3.14 Forth bigForth 3.20 Haskell GHC 4.22 Smalltalk VisualWorks 4.44 Erlang HiPE 4.58 Erlang HiPE #2 4.59 Scheme MzScheme 4.94 Scala 5.70 Haskell GHC #3 6.09 Lua #3 6.37 Pike 6.39 Python 6.46 Mozart/Oz #2 6.61 Perl #2 6.81 PHP 7.06 Tcl #2 7.28 Ruby 7.49
.
There are a couple of features that weren't obvious in at first. There is a noticable gap between C++ g++ and Nice, a huge gap between Forth bigForth and Haskell GHC #2, and another between Scheme MzScheme and Scala. Lua #3 is pretty close to Pike, even though they differ by 16 seconds real-time, but Nice and g++ are further apart even though they differ by less than 4 seconds of real time. I have a further refinement in the next post.Wednesday, July 18, 2007
Well, I wrote some clustering code, but it isn't staggering into life yet.
I've been distracted by a new problem at work: making sense out of tens of thousands of data points. We have a number of computers that the QA group uses. I had the idea that we should probe them and collect some statistics. With enough statistics, maybe we'll see some trends or something.
I wrote a small script that goes to each QA machine, pings it, and if it is alive, logs in and collects a bunch of basic info like physical memory in use, swap space in use, load average, number of threads, etc. The results are stored in a file with the machine name and a timestamp for when the sample was taken. Over the past couple of weeks I've collected over 100 thousand samples of about 13 different values in each sample. (Parts of the sample are pretty static: the total size of physical memory doesn't change, and the operating system is only changed rarely, but these are interesting values to have at hand.)
The problem now is to extract some information from this pile of raw data. This isn't as easy or obvious as I had thought it would be. My first experiment was to examine the load averages. I figured that maybe we could tell the difference between machines that were in use and those that were idle, or between correctly running machines and broken ones. Maybe we'd see a correlation between the amount of RAM and the load. Little did I know....
(more later)
Tuesday, July 3, 2007
Playing with Bayesian filters
I wrote a simple bayesian filter as a prelude to the clustering stuff I've been thinking about. Nothing too fancy here, but I was playing with some series code as well. I've been using the Lingspam corpus to measure against.
Subscribe to:
Posts (Atom)