Tuesday, December 11, 2007
How many strings can you intern?
You're a regular when...
That's me and the missus hanging out.
Drop in if you want to talk Lisp or Scheme. I'm there nearly every evening.
Monday, December 10, 2007
You can just hire a company to put a satellite in orbit. The Falcon 9 is supposed to be “the lowest cost per pound to orbit” and it costs $35M to put a small satellite into geosynchronous transfer orbit. Of course the Falcon 9 doesn't actually exist yet, but if it did, you'd only start out $15M in the hole.
Part of the problem of a rocket is that you spend a lot of the energy lifting the fuel and oxygen to the altitude where you plan to use them. I was daydreaming a way to avoid that. If you use a ramjet or scramjet for the lower altitudes, you can use the existing oxygen in the air. This cuts the amount of lifting you have to do by half. Now if you could just figure out a way to get the fuel to where you need it without having to carry it with you.
My initial infeasible idea was to have a long hose.
But then I was thinking that you don't really need a hose to keep the fuel confined. If you squirt a droplet or two of fuel in the path of the oncoming jet, it can be sucked into the intake just like the oxygen. It shouldn't be that hard to time it right. Of course it wouldn't be possible to build a tower tall enough to make this useful, but maybe if you put the tower on the side of a mountain so you can get a few miles of thrust before you have to use the internal fuel supply.
Monday, November 26, 2007
Origin of CAR and CDR
“It was soon noticed that extraction of a subexpression involved composing the extraction of the address part with cwr and that continuing along the list involved composing the extraction of the decrement part with cwr. Therefore, the compounds car, standing for ``Contents of the Address part of Register number'', and its analogs cdr, cpr, and ctr were defined. The motivation for implementing car and cdr separately was strengthened by the vulgar fact that the IBM 704 had instructions (connected with indexing) that made these operations easy to implement.”--- John McCarthy, History of Lisp
The IBM 704 was not an early lisp machine.
Greenspun's Tenth Rule of Programming
This quote is attributed to Philip Greenspun. Lately it seems someone got confused and attributed it to someone else and I'm seeing the misattribution over and over.
Thursday, November 22, 2007
In the Kingdom of Nouns
null.
null is a true oddity in the Kingdom of Nouns. He is a second-class
citizen. This is no doubt due to the fact that he is completely and
utterly incapable of even the most trivial of actions. Whenever he is
asked to perform a task, he responds by taking Exception and throwing a tantrum. Every other citizen in the Kingdom is expected
to at least know his Class and how to present himself to the public. Not null, though.
The residents of the Kingdom take pride in order, so you might imagine that
null's behavior would make him an outcast in the Kindom of Nouns.
In fact, he had been disinherited by every single family in the
kingdom!
null desperately wanted something to do. People would assign him
mundane tasks like standing in for a citizen that was shortly expected
to arrive or standing at the end of a line as a sort of marker.
Occasionally when a request came from the castle, null would return to
deliver the news that no one was able to satisfy the request.
Not everyone was impressed by
null's `ability' (so to speak) to take
up space. Sometimes, you just need a member of the right family or
someone that is capable of performing a well-defined task.
Requirements like these were spelled out explicitly in the contracts
that people made: (TaskManager applicant) or (IMowLawns teenager).
But because null was the king's brother, he had a special dispensation
to ignore these restrictions. He'd walk right on in and pretend to be
the manager or the teenager. Of course as soon as you asked him to
do something, like start the mower or even tell you his name, he'd
take Exception and throw another tantrum.
Some people just tried to pretend that
null didn't exist and hope that
the king or somebody would catch him as he threw his tantrum. Others
took the time to proofread their contracts and add extra clauses
everywhere to exclude null or deal with him in some ad-hoc way.
Unfortunately, there is no happy ending to this story.
null continues
vex and irritate the citizens of the Kingdom of Nouns and no relief is
in sight.
Tuesday, November 20, 2007
Tuesday, October 9, 2007
Signs of life
MAKE-INSTANCE with the generic version. On the next call to MAKE-INSTANCE a lot of stuff happens that eventually lands us in the yet-to-be-implemented primary method of MAKE-INSTANCE.At this point, I need to clean up a few of the kludges and finish implementing a few of the important functions (for example, my wimpy sort routine only works on lists of a single element so far).
Monday, October 8, 2007
Function Cells in C#
delegate type for the signature of the function:delegate object FooFunction (string s, int i);In the class where the function
Foo will be defined, we create a static variable to hold the delegate:static FooFunction currentFooFunction;and a Property to read it:
public static FooFunction Foo

{

    get

    {

        return currentFooFunction;

    }

}
You can now write code like this:
object bar = Foo("test", 4);which appears to be an ordinary static function call, but in actuality is a call that indirects through the
currentFooFunction.The basic trick here is to have a Property that returns a delegate. The Property code can perform an arbitrary computation to return the delegate, and the compiler knows that a delegate returned from a Property call can be used in a syntactic function position.
Friday, October 5, 2007
That is my final answer
The problem is that the method object held by the .NET delegate is a read-only object. It cannot be overwritten. No problem, we'll just indirect through the field we can write. But we need to pass in the delegate object itself as an argument so we can modify it. In order to do that the delegate method needs access to the
this pointer in the delegate. But the point of a delegate is to provide the delegated method with a this pointer. That is the Target field in the delegate. But the target object held by the .NET delegate is also read-only. It isn't possible to construct a delegate that delegates to itself in .NET (at least not without major black magic). We can create a delegate that delegates to a static method within the delegate class itself, but then we no longer have access to the instance object.The solution is another level of indirection. We create a
ManifestInstance class that has mutable state we need and closes over itself. The delegate simply defers to the ManifestInstance. This is the way delegates are intended to be used, so there is no need to use IL to add extra fields or anything. We can do this with standard, simple C#.But I still want my
StandardObjects to be printed with some sort of useful debugging info rather than {Method = {System.Object uninitializedFuncallableInstanceMethod(System.Object[])}}. The StandardObject delegate needs a DebuggerTypeProxy. A DebuggerTypeProxy is a helper object that tells the debugger how to render objects when the standard mechanisms aren't sufficient. But for reasons I don't understand, you can't associate a DebuggerTypeProxy with a .NET delegate! Argh!!!!But I found a trick. You can associate a
DebuggerDisplay attribute with a delegate. This is a string attribute that is interpreted in the context of the object being debugged. You can put things like "Object {Name}" in the DebuggerDisplay attribute and it will print the literal string `Object' followed by the Name field of the object. For our StandardObject delegate, we tell it to print the Target field. This sort of works: "{Target}", but then the debugger uses the ToStringmethod of the ManifestInstance. It makes it hard to visually distinguish the ManifestInstance from the delegate that refers to it. Instead, we want to get a computed property of the ManifestInstance. Unfortunately, this doesn't work: "{Target.ObjectDebuggerDisplay}", but this does: "{((ManifestInstance)Target).ObjectDebuggerDisplay}". Now when the debugger sees a StandardObject, it calls a method defined in ManifestInstance that has access to the object's state.Since all this can be done in simple C# code, there is no reason to hack IL for
StandardObjects. Back to the hacking....
Thursday, October 4, 2007
Trying again
standard-object implemented in a separate assembly is getting unweildy. I think I'm going to return to the manifest-instance technique.The Visual Studio debugger can use certain annotations on your code to make debugging more pleasant. For example, I have annotated my Keyword and Symbol classes so that the watch window can print them correctly (not quite exactly, yet --- no escaping). When I hit a breakpoint, I can get a display like this:
| Name | Value | Type |
|---|---|---|
| foo | :NAME | object{Lisp.Keyword} |
| bar | CLOS::STANDARD-GENERIC-FUNCTION | object{Lisp.Symbol} |
Right now, however, my StandardObject delegates are printing like this:
| Name | Value | Type |
|---|---|---|
| generic | {Method = {System.Object uninitializedFuncallableInstanceMethod(System.Object[])}} | object{Lisp.StandardObject} |
That's not so useful. I can add the debugging annotations to the StandardObject, but since it is in a different assembly, it creates a circular dependency. If I go back to the somewhat more clunky, but portable representation, I'll find it a lot easier to debug.
Later that same day....
Argh. You can't add a debugger type proxy to a delegate in C#. Back to IL.
Monday, October 1, 2007
Standard Object
CLOS has a couple of interesting requirements that can be tricky to implement. The first is the ability to construct
funcallable-standard-instances, that is, first-class procedure objects that can have additional data associated with them. The second is the ability to call change-class on an instance to transform it in place to an instance of another class. (Why would I want to do that?! Normally, a user of CLOS wouldn't want to or need to do something so horrendous to an object, but if you are using a REPL and change a class definition by reloading a file, you want the system to update existing instances to the new schema. Rather than forcing the user to exit the REPL, recompile, reload, and then reconstruct his state, we tweak the objects behind the scenes and keep going.) If we combine these features we can potentially turn any instance into a procedure. (No, we don't want to design features that deliberately use this ability, we want to allow the user to type defclass..., say `Oops! I meant defgeneric...,' and do the fixup on the fly.)The CLR has first-class functions called delegates. A delegate is basically an object that contains an object and a reference to a method implemented by the object. When the delegate is invoked, the method within the object is invoked and the answer is returned. If we consider the method to be a piece of code and the object to be an environment, then we can see that a CLR delegate is simply a closure. If we use delegates to implement
funcallable-standard-instances, then our CLOS generic functions can be used anywhere a delegate can (modulo type co- and contra- variance). A non-funcallable standard-instance can simply be a delegate that refers to a method that raises an exception.We need to associate some additional data with our standard-instances. First, an instance has an associated class object. While it is true that our delegates have an associated .NET type, it is always going to be the
System.Delegate type and the .NET types are insufficient for our purposes. Second, an instance has an associated set of `slots'. We need the ability to both refer to these elements and to replace them in order to implement change-class. There are a couple of strategies that will work here. One is to hold the additional data in a weak hash table keyed by the delegate. This technique was used in the original version of Swindle, but the hash lookup will incur a fair amount of overhead. A portable technique is to define a helper class with the necessary fields:
class ManifestInstance

{

    StandardObject class;

    object [] slots;

    function onFuncall;

}
A StandardObject would be a delegate to a trampoline function in
ManifestInstance. This technique works, but it seems kind of a kludge. We'd like to have our own special subclass of delegate that simply has two additional fields. (We'll have an additional benefit: the debugger will show us the class and slots as immediate subvalues in the delegate. If we indirect through a ManifestInstance, we have to manually chase down the pointer in the debugger.) We can create subclasses of delegates by using the delegate declaration in C#, but we can't add any new fields.We can, however, do this trick in IL and assemble it into a signed assembly that can be placed in the GAC. We can then just add a reference to it in VC#.
I've added some code for this in http://jrm-code-project.googlecode.com/svn/trunk/Jrm.StandardObject/. I'm still tweaking it a bit, but it seems to be working.
Monday, September 17, 2007
This just keeps getting better and better! Now I can't debug because something is timing out the script and aborting the process before I can look at what is going on.
Weekend update
Thursday, September 13, 2007
Past that hurdle
Tuesday, September 11, 2007
Got it!
Monday, September 10, 2007
A Clue
More fooling around with scripting
Saturday, September 8, 2007
Playing around
Friday, September 7, 2007
Saturday, August 18, 2007
How I do love blogging
Another Couple of Graphs
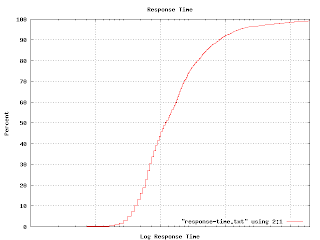 I mentioned in an earlier post that I tried using a cumulative probability graph without much success. It turns out that this sort of graph comes in handy for answering particular kinds of questions. For example, I wanted to illustrate the various response times of one class of machines, so I generated this graph. (The actual graph has numbers along the X axis. Imagine that the tic marks represent `centons' in the middle, `microns' to the left and `arns' to the right.)
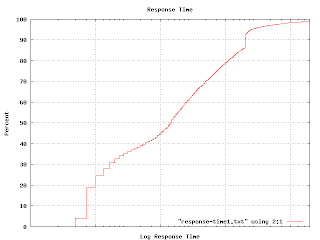
The percent axis tells you what percent of response times are faster than the graphed point. That is, to find the median response time, go to the 50% mark and read across and then down. You'll find that the median is a tad over 1 centon. Half of the responses happen faster, half take longer. The 92 percentile is at 1 'arn'. It is pretty unlikely you'd have to wait this long for an answer, but not impossible. Very few responses seem to come in at a `micron'. It turns out that many measurable properties have these S-shaped curves. That isn't surprising because this curve is simply the integral of the underlying distribution (which is often Gaussian). But plotting like this avoids the bucketing issues I was having earlier. If you plot a graph like this and find kinks and non-linearities in it, you have discovered some outliers. This graph shows one.
Thursday, August 9, 2007
What's missing from this picture?
class Node {
    int value;
    Node parent;
}
Well, it is certainly space efficient. Optimized for going up the tree, too.
Tuesday, August 7, 2007
Naive Bayesian Classifier
(define (10log10 x)
  (* 10.0 (/ (log x) (log 10.0))))
;
(define (sum f list)
  (fold-left (lambda (sum element)
               (+ sum (f element)))
             0
             list))
;
(define (count-if predicate list)
  (sum (lambda (element)
         (if (predicate element)
             1
             0))
       list))
;
(define (count-if-not predicate list)
  (sum (lambda (element)
         (if (predicate element)
             0
             1))
       list))
;
(define (weight-if-present has-feature? positive-examples
                                        negative-examples)
  (10log10
   (/ (* (+ (count-if has-feature? positive-examples) .5)
         (length negative-examples))
      (* (+ (count-if has-feature? negative-examples) .5)
         (length positive-examples)))))
;
(define (weight-if-absent has-feature? positive-examples
                                       negative-examples)
  (10log10
   (/ (* (+ (count-if-not has-feature? positive-examples) .5)
         (length negative-examples))
      (* (+ (count-if-not has-feature? negative-examples) .5)
         (length positive-examples)))))
;
(define (weight has-feature?
                positive-examples negative-examples
                test-element)
  (if (has-feature? test-element)
      (weight-if-present has-feature? positive-examples
                                      negative-examples)
      (weight-if-absent  has-feature? positive-examples
                                      negative-examples)))
;
(define (naive-bayesian-classifier feature-list positive-examples
                                                negative-examples)
  (lambda (test-element)
    (sum (lambda (feature)
           (weight feature
                   positive-examples negative-examples
                   test-element))
         feature-list)))
.
Obviously this can radically improved for performance. Also note that your version of Scheme might take the arguments to fold-left in a different order. In Statistics and the War on Spam, Dave Madigan gives a really good introduction to naive Bayesian classifiers. The implementation above is based on that paper. The paper also describes why you add .5 to all the counts. To take the example directly from the paper:
;;; Message sets with stop words removed
;;; and word stemming applied.
(define *ham-messages*
  '((brown fox quick)
    (rabbit run run run)))
;
(define *spam-messages*
  '((quick rabbit run run)
    (rabbit rest)))
;
;;; A list of six procedures, each tests for
;;; the presence of a single word in a message.
(define *features*
  (map (lambda (word)
         (lambda (message)
           (member word message)))
       '(brown fox quick rabbit rest run)))
;
(define *example-classifier*
  (naive-bayesian-classifier
   *features*
   *ham-messages*
   *spam-messages*))
;
;;; Classify a new message.
(*example-classifier* '(quick rabbit rest))
;Value: -11.426675035687316
.
The value returned differs from the one in the paper for two reasons. I use positive values to indicate `ham' and negative for `spam', rather than vice-versa. I also compute the logarithm in base 10 rather than the natural log and multiply the result by 10 (decibels rule!). This makes it much easier to eyeball the results. Negative is bad, and every 10 dB is another order of magnitude. With a value of -11, I can see that this is spam with a better than 90% probability. (10 dB = 90%, 20 dB = 99%, 30 dB = 99.9%, 40 dB = 99.99%, etc.) Stupid blogger removes blank lines in PRE sections, so I inserted semicolons. It also has problems transitioning back out of PRE, so I have periods in there as well. I don't like to blog anyway, and this just adds another reason to avoid it.Wednesday, July 25, 2007
From Histograms to Scatter Plots
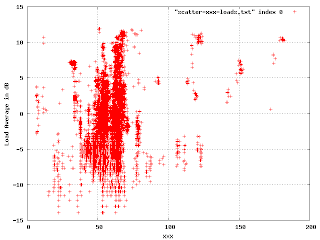 In this, we're plotting the load average (in dB) against a shared resource. The points outside the big blob are of interest. Where there is a cluster of points, like at (40, 7), I found that it was a single machine that was misconfigured in some particular way. The correctly working machines produced this part of the plot:
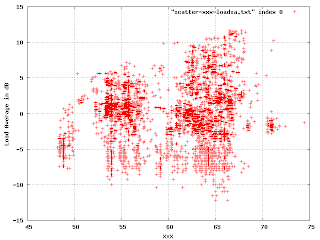 There is an obvious multi-modal distribution here that would have been difficult to see by plotting just one or the other variable.
Where's the Lisp?
More Graphs
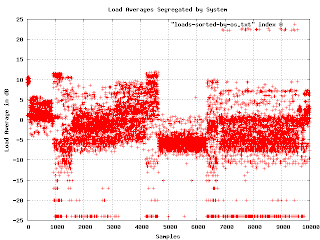 Now I was getting somewhere. It seems that the load averages are strongly affected by the underlying operating system. On one level, this isn't surprising, but since the various OS are supposed to be very similar, I expected much less variation. Apparently OS selection is much more important than I thought.
I found a problem with this graph. When I showed it to people, they wanted to know what the X axis is (it isn't much of anything in this graph except that each data point has a different value for X). Lexicographical ordering of the OS isn't really related to the linear axis other than for grouping purposes. The important feature is that different OSs have different bands of density in the sample space. What I really needed was to separate the graphs and plot the density as a histogram. This turns out to be a lot easier said than done.
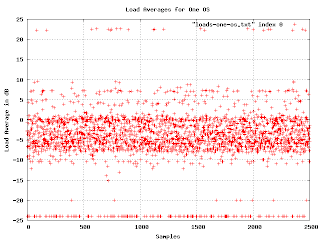 Here are the load averages for one particular OS (the one that occupies the range from 7000 to 9500 in the earlier graph). You can just make out two density bands. What we want is a simple histogram of the density as it changes when we go from the bottom to the top of the graph. No problem:
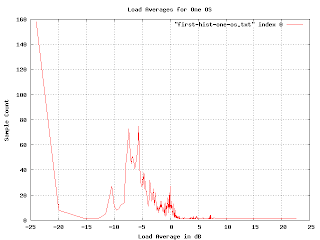 But something is wrong here. There are some bumps in the graph where you would expect, but the sizes are wrong. The peak for the loads at -5dB is much bigger than the one at 0dB, but the density of points at -5db doesn't seem much higher than that at 0dB. And shouldn't there be a blip up at 23dB?
Since we are using the logarithm of the load average, the buckets for the histogram are non uniform (in fact, they are exponentially decreasing in size). We can fix this by multiplying by a normalization factor that increases exponentially.
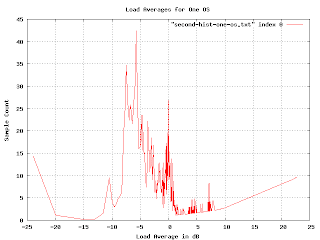 This is more realistic, but the exponential multiplication gives some weird artifacts as we approach the right-hand side. Since we know that load averages won't normally exceed 13dB, we really want to just look at the middle of the graph.
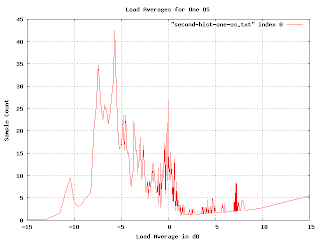 The problem we are encountering here is that graph is far too jagged as we approach the right-hand side. This is because the buckets are getting very fine-grained as the load gets higher. We want to smooth the histogram, but we want the smoothing to encompass more and more buckets as we reach the higher loads. I spent a couple of days trying to figure out how to convolve this graph with a continuously varying gaussian curve. I actually got somewhere with that, but it was really hard and very slow (you have to do a lot of numeric integration). Raph Levien suggest punting on this approach and just plotting the accumulated loads. I tried this, but for this particular problem it doesn't give the information I wanted. (I mention this because the idea turns out to be applicable elsewhere.)
Over the weekend I had an insight that in retrospect seems obvious. I guess I was so stuck in the approach I was working on that I didn't see it. (The seductive thing about my approach is that I was making progress, it just was getting to the point of diminishing returns). The buckets are hard to deal with because they vary in size. They vary in size because I took the logarithm of the load. If I simply perform the accumulation and smoothing before taking the logarithm all the problems go away. (Well, most of them, I still need to vary the smoothing, but now I can vary it linearly rather than exponentially and I can use addition rather than convolution). Here is what the graph looks like when you do it right:
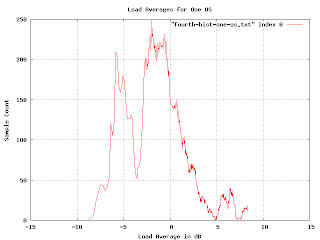 In order to check if I was doing it right, I generated some fake data with varying features (uniform distributions, drop-outs, gaussians, etc.) and made sure the resulting histogram was what I expected. I'm pretty confident that this histogram is a reasonably accurate plot of the distribution of load averages for the system in question.
(more later...)
Some Graphs, Maybe
 What do you know? It worked!
This is the first graph I made from the data I've collected. I wasn't really expecting much, but there are a few things to notice: first, there is a really unhappy machine with a load average in the 170 range. Second, my scanning program does not poll at regular intervals.
The unhappy machine turned out to be missing an important library. Unfortunately, the software reacted to this problem by spawning a process that itself depended on the library. When I checked, the machine had several thousand failing processes.
Other than those two facts, the graph isn't very informative. Everything is squeezed down into the bottom. But watch what happens when I convert the load average to decibels.
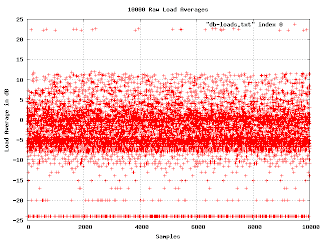 Now things start to get interesting. In the middle of the graph are two bands of higher density. This indicates a bimodal distribution of loads. It would be good to find out what causes that. Another thing to notice is that if we ignore the misconfigured machine, the graph has a fairly sharp upper edge at about 13dB. We can say that if the machine load ever gets above 13dB, it is clearly in trouble.
At the bottom of the graph the load averages fall into discrete lines. This is an artifact of the way loads are reported. They are rounded to the nearest hundredth, and when we show them in log scale, the rounding becomes obvious at the bottom of the graph.
(more soon...)
Thursday, July 19, 2007
An Unorthodox Idea: Measure Computer Performance in dB
C gcc                    7.6
D Digital Mars           8.2
Clean                    8.3
Lisp SBCL #2             8.6
Oberon-2 OO2C            8.7
Pascal Free Pascal #3    8.8
D Digital Mars #2        8.9
OCaml                    9.1
Eiffel SmartEiffel       9.1
Ada 95 GNAT              9.9
C++ g++                 10.0
Nice                    11.4
Java 6 -server          11.7
Scala #2                11.7
CAL                     12.3
BASIC FreeBASIC #2      12.3
SML MLton               12.5
Haskell GHC #2          12.6
C# Mono                 12.8
Fortran G95             13.6
Forth bigForth          13.9
Haskell GHC             18.4
Smalltalk VisualWorks   19.3
Erlang HiPE             19.9
Erlang HiPE #2          19.9
Scheme MzScheme         21.5
Scala                   24.8
Haskell GHC #3          26.5
Lua #3                  27.7
Pike                    27.8
Python                  28.1
Mozart/Oz #2            28.7
Perl #2                 29.6
PHP                     30.7
Tcl #2                  31.6
Ruby                    32.5
.
So what can we see? SBCL is just a tad slower than C gcc, but it is a tad faster than C++ g++. Scheme MzScheme is an order of magnitude slower than C++, but Perl is yet another order of magnitude slower. Between MzScheme and Scala you lose a factor of 2. There are other things you can do with dB, for example, you can measure compiler performance. A Scheme compiler that improves performance by, say, 12dB would move the Scheme runtime up near the Ada one. You might decide that a compiler tweak that improves performance by less than 1dB probably isn't worth it. Try converting some of your own performance numbers to dB and see what you think.Reporting Performance
C gcc                   5.82
D Digital Mars          6.57
Clean                   6.78
Lisp SBCL #2            7.20
Oberon-2 OO2C           7.39
Pascal Free Pascal #3   7.60
D Digital Mars #2       7.80
OCaml                   8.06
Eiffel SmartEiffel      8.22
Ada 95 GNAT             9.78
C++ g++                 9.95
Nice                   13.89
Java 6 -server         14.63
Scala #2               14.67
CAL                    16.93
BASIC FreeBASIC #2     17.15
SML MLton              17.93
Haskell GHC #2         18.32
C# Mono                18.85
Fortran G95            23.02
Forth bigForth         24.46
Haskell GHC            69.09
Smalltalk VisualWorks  84.80
Erlang HiPE            97.60
Erlang HiPE #2         98.30
Scheme MzScheme       139.75
Scala                 299.77
Haskell GHC #3        441.82
Lua #3                582.46
Pike                  598.58
Python                641.36
Mozart/Oz #2          739.06
Perl #2               906.29
PHP                  1165.02
Tcl #2               1456.69
Ruby                 1786.76
.
Now the timings in log scale:C gcc 1.76 D Digital Mars 1.88 Clean 1.91 Lisp SBCL #2 1.97 Oberon-2 OO2C 2.00 Pascal Free Pascal #3 2.03 D Digital Mars #2 2.05 OCaml 2.09 Eiffel SmartEiffel 2.11 Ada 95 GNAT 2.28 C++ g++ 2.30 Nice 2.63 Java 6 -server 2.68 Scala #2 2.69 CAL 2.83 BASIC FreeBASIC #2 2.84 SML MLton 2.89 Haskell GHC #2 2.91 C# Mono 2.94 Fortran G95 3.14 Forth bigForth 3.20 Haskell GHC 4.22 Smalltalk VisualWorks 4.44 Erlang HiPE 4.58 Erlang HiPE #2 4.59 Scheme MzScheme 4.94 Scala 5.70 Haskell GHC #3 6.09 Lua #3 6.37 Pike 6.39 Python 6.46 Mozart/Oz #2 6.61 Perl #2 6.81 PHP 7.06 Tcl #2 7.28 Ruby 7.49
.
There are a couple of features that weren't obvious in at first. There is a noticable gap between C++ g++ and Nice, a huge gap between Forth bigForth and Haskell GHC #2, and another between Scheme MzScheme and Scala. Lua #3 is pretty close to Pike, even though they differ by 16 seconds real-time, but Nice and g++ are further apart even though they differ by less than 4 seconds of real time. I have a further refinement in the next post.Wednesday, July 18, 2007
Tuesday, July 3, 2007
Playing with Bayesian filters
Tuesday, June 26, 2007
How Floating Point Works
            -25     12582912
12582912 * 2   = ------------- = 3/8
                    33554432
in single precision floating point. In double-precision, 3/8 is represented as
                    -54    6755399441055744
6755399441055744 * 2   = ------------------- = 3/8
                          18014398509481984
.
Not every fraction can be represented. For example, the fractions 1/10 and 2/3 cannot be represented. Only those fractions whose denominator is a power of 2 can be represented.
It is possible to represent integers. For instance, the integer 123456 is represented as
            -7    15802368
15802368 * 2   = --------- = 123456
                       128
.
Not every integer can be represented. For example the integer 16777217 cannot be represented in single precision.
--------
When floating-point numbers appear in programs as literal values, or when they are read by a program from some data source, they are usually expressed as a decimal number. For example, someone might enter "38.21" into a form. Some decimal numbers, like 0.125, can be represented as a floating-point number, but most fractional decimal numbers have no representation.
If a literal number cannot be represented, then the system usually silently substitutes a nearby representable number.
For example, if the expression 0.1 appears as a literal in the code,the actual floating point value used may be
            -27     13421773
13421773 * 2   = ------------- > .1
                   134217728
.
as another example, 38.21
            -18     10016522
10016522 * 2   = ----------- < 38.21
                      262144
.
Most implementations substitute the nearest representable number,but this has not always been the case.
As it turns out, much of the error in floating-point code comes from the silent substitution performed on input.
--------
Floating-point numbers are usually printed as decimal numbers. All binary floating-point numbers have an exact decimal equivalent, but it usually has too many digits to be practical. For example, the single-precision floating-point number
            -25     13421773
13421773 * 2    = ----------- = 0.4000000059604644775390625
                    33554432
.
Furthermore, the extra digits may be misconstrued as precision that doesn't exist. The next largest float above that:
             -25     6710887
13421774 * 2    = ----------- = 0.400000035762786865234375
                    16777216
.
doesn't share any digits beyond the first 7.
There is no standard way to print the decimal expansion of a floating-point number and this can lead to some bizarre behavior. However, recent floating point systems print decimal numbers with only as many digits as necessary to ensure that the number will be exactly reconstructed if it is read in. This is intended to work correctly even if the implementation must substitute a nearby representable number on input. This allows one to `round-trip' floating-point numbers through their decimal representation without error.
(NOTE: Not all floating point systems use this method of parsimonious printing. One example is Python.)
There is a curious side effect of this method of printing. A literal floating-point number will often print as itself (in decimal) even if it was substituted in binary. For example, if the expression 0.1 appears as a literal in the code, and is substituted by
            -27      13421773
13421773 * 2    = -------------
                    134217728
.
this substitute number will be printed as "0.1" in decimal even though it is slightly larger than 0.1
As mentioned above, Python does not use parsimonious printing, so it is often the case in Python that a literal floating-point number will not print as itself. For example, typing .4 at the Python prompt will return "0.40000000000000002"
The round-trip property is nice to have, and it is nice that floating-point fractions don't seem to change, but it is important to know this fact:
The printed decimal representation of a floating-point number may be slightly larger or smaller than the internal binary representation.
--------
Arithmetic
Simple arithmetic (add, subtract, multiply, or divide) on floating-point numbers works like this:
1. Perform the operation exactly. Treat the inputs as exact rationals and calculate the exact rational result.
2a. If the exact rational result can be represented, use it.
2b. If the exact rational result cannot be represented, use a nearby exact rational that can be represented. (round)
This is important, and you may find this surprising:
Floating-point operations will produce exact results without rounding if the result can be represented.
There are a number of interesting cases where we can be assured that exact arithmetic will be used. One is with addition, multiplication,and subtraction of integers within the range of the significand. For single-precision floating point, this is the range [-16777215,16777215]. For double-precision,
[-9007199254740991,9007199254740991]. Even integer division (modulo and remainder) will produce exact results if the inputs are integers in the correct range. Multiplication or division by powers of two will also produce exact results in any range (provided they don't overflow or underflow).
In many cases floating-point arithmetic will be exact and the only source of error will be the substitution when converting the input from decimal to binary and how the result is printed.
However, in most cases other than integer arithmetic, the result of a computation will not be representable in the floating point format. In these case, rule 2b says that the floating-point system may substitute a nearby representable number. This number, like all floating-point numbers, is an exact rational, but it is wrong. It will differ from the correct answer by a tiny amount. For example, in single precision adding .1 to 0.375:
             -27     13421773
13421773 * 2    = ------------- ~= 0.1
                    134217728

             -25     12582912
12582912 * 2   = ------------- = 0.375
                     33554432
.
gives us a result that is slightly smaller than the true answer of 19/40
            -25     15938355       19
15938355 * 2   = ------------- < ---
                    33554432       40
--------
Further topics
1. Denormalized numbers and gradual underflow. These give you a `soft landing' when you use numbers really close to 0.
2. Infinities
3. Negative 0.0
4. NaN's
5. Traps and flags
--------
Floating point myths
Myth: Floating-point numbers are an approximation.
Fact: Floating-point numbers are exact, rational numbers.
Myth: Floating-point math is always only an approximation, and all results are off by a small amount.
Fact: Many floating-point operations produce exact, correct answers.
Myth: Floating-point math is mysterious.
Fact: It is the same old rational arithmetic you've used for ages.
--------
Bibliography
@article{ goldberg91what,
author = "David Goldberg",
title = "What Every Computer Scientist Should Know About Floating-Point Arithmetic",
journal = "ACM Computing Surveys",
volume = "23",
number = "1",
pages = "5--48",
year = "1991",
url = "citeseer.ist.psu.edu/goldberg91what.html" }
All the papers at http://www.cs.berkeley.edu/~wkahan/
Joe Darcy's talk at http://blogs.sun.com/darcy/resource/Wecpskafpa-ACCU.pdf
Sunday, June 24, 2007
Why floating-point numbers are not intervals
                    float operation
     floating  ------------------------>  floating
      point                                 point
        |                                     ^
        |                                     |
        |                                     |
        |                                     |
        |                                     |
        V         interval operation          |
     interval ------------------------->  interval
Interval view In this view, there is a mapping from floating point numbers to intervals. For each floating point operation, there is an operation on the intervals that the floats map to. The resulting intervals are then mapped to the corresponding floating point result. An alternative view is this:
                    float operation
     floating  ------------------------>  floating
      point                                 point
        |                                     ^
        |                                     |
        |                                  possible
        |                                  rounding
        |                                     |
        V      exact rational operation       |
     rational ------------------------->  rational
Rational View In this view, each floating point number represents an exact rational number. Operations on floating point numbers are mapped to the corresponding exact rational operation. If necessary, the resulting exact rational number is mapped to an appropriate floating point number by rounding. Since some rationals correspond exactly to floating point values, rounding may not be necessary. Are these views equivalent? For our purposes, an interval is a set of real numbers we can describe by two endpoints, the lower bound and the upper bound. Either of the endpoints may be part of the interval or not. Given an arbitrary real number X, any pair of real numbers, one of which is below the rational, one of which is above, will define an interval that contains X. There is no one-to-one mapping from rational numbers to intervals: a rational number such as 5/8 is contained by any interval with a lower bound less than 5/8 and an upper bound greater than 5/8. For example, the intervals [0, 30), (1/2, 1], and (9/16, 11/16) all contain 5/8. Also, any non-degenerate interval (that is, where the endpoints are distinct), contains an infinite number of rationals. These views cannot be semantically equivalent, but are they *computationally* equivalent? A computation that used the interval model may yield the same floating point result as one that performed under the rational model. (Obviously, we would reject a model which didn't give the result `1 + 1 = 2'.) But do all computations performed by one model yield the same answer as the other? If not, then we can at least distinguish which model an implementation uses if not decide which model is better. To determine computational equivalence, we need to be precise about what operations are being performed. To aid in this, I have defined a tiny floating point format that has the essential characteristics of binary floating point as described by IEEE 754. This format has 2 bits of significand and 3 bits of mantissa. The significand can take on the values 0-3 and the exponent can take on the values 0-7. We can convert a tiny float to an exact rational number with this formula: (significand + 5) * 2 (exponent - 5) There are 32 distinct tiny floating-point values, the smallest is 5/32 and the largest is 32. I use the notation of writing the significand, the letter T, then the exponent. For example, the tiny float 2T3 is equal to (2 + 5) * (2 ^ (3 - 5)) = 1 3/4. Since there are so few of them, we can enumerate them all:
0T0 = 5/32     0T2 = 5/8    0T4 = 5/2   0T6 = 10
1T0 = 3/16     1T2 = 3/4    1T4 = 3 1T6 = 12
2T0 = 7/32     2T2 = 7/8    2T4 = 7/2  2T6 = 14
3T0 = 1/4      3T2 = 1      3T4 = 4 3T6 = 16
0T1 = 5/16     0T3 = 5/4    0T5 = 5 0T7 = 20
1T1 = 3/8      1T3 = 3/2    1T5 = 6 1T7 = 24
2T1 = 7/16     2T3 = 7/4    2T5 = 7 2T7 = 28
3T1 = 1/2      3T3 = 2      3T5 = 8    3T7 = 32
Table of tiny floats We can also enumerate the intervals on the real number line that map to tiny floats:
0T0 = [5/32  11/64]   0T2 = [ 9/16 11/16]
1T0 = (11/64 13/64)   1T2 = (11/16 13/16)
2T0 = [13/64 15/64]   2T2 = [13/16 15/16]
3T0 = (15/64  9/32)   3T2 = (15/16  9/8 )
0T1 = [ 9/32 11/32]   0T3 = [ 9/8  11/8 ]
1T1 = (11/32 13/32)   1T3 = (11/8  13/8 )
2T1 = [13/32 15/32]   2T3 = [13/8  15/8 ]
3T1 = (15/32  9/16)   3T3 = (15/8   9/4 )

0T4 = [ 9/4 11/4]     0T6 = [ 9 11]
1T4 = (11/4 13/4)     1T6 = (11 13)
2T4 = [13/4 15/4]     2T6 = [13 15]
3T4 = (15/4  9/2)     3T6 = (15 18)
0T5 = [ 9/2 11/2]     0T7 = [18 22]
1T5 = (11/2 13/2)     1T7 = (22 26)
2T5 = [13/2 15/2]     2T7 = [26 30]
3T5 = (15/2  9)       3T7 = (30 32)
Table of real intervals Arithmetic on intervals is relatively easy to define. For closed intervals, we can define addition and subtraction like this: [a b] + [c d] = [a+c b+d] [a b] - [c d] = [a-d b-c] Multiplication and division are a bit trickier: [a b] * [c d] = [min(ac, ad, bc, bd) max(ac, ad, bc, bd)] [a b] / [c d] = [min(a/c, a/d, b/c, b/d) max(a/c, a/d, b/c, b/d)] The formulae for open and semi-open intervals are similar. A quick check: 1 is in the interval (15/16 9/8). (15/16 9/8) + (15/16 9/8) = (15/8 9/4) 2 is in the interval (15/8 9/4), so 1 + 1 = 2. So far, so good, but we will soon discover that interval arithmetic has problems. The first hint of a problem is that the intervals are not of uniform size. The intervals at the low end of the line are much smaller than the intervals at the high end. Operations that produce answers much smaller than the inputs will have answers that span several intervals. For example, 20 - 14 20 is in the interval [18 22] 14 is in the interval [13 15] [18 22] - [13 15] = [3 9] We have 7 intervals that fall in that range, but none are large enough to cover the result. The second hint of a problem comes when multiply. It is true that 1+1=2, but does 1*2=2? 1 is in the interval (15/16 9/8) 2 is in the interval (15/8 9/4) (15/16 9/8) * (15/8 9/4) = (225/128 81/32) This is clearly not the same as (15/8 9/4). It seems that we have lost the multiplicative identity. An adherent of the interval model will have to come up with a way to map these arbitrary result intervals back into the floating-point numbers. In an upcoming post, I'll describe the rational model in more detail.
Monday, June 18, 2007
Friday, June 15, 2007
A Short Digression into a Question of Bits
(defun log2 (n)  "Log base 2" (/ (log n) (log 2)))
(defun question-bits (p)
  "Given the probability that a question is true, return
   the number of bits of information you can expect by
   asking the question."
  (let ((p~ (- 1.0 p)))
    (+ (* p  (- (log2 p)))
       (* p~ (- (log2 p~))))))

(question-bits .5) =>  1.0   ; a fifty-fifty question gives us one bit
(question-bits .25) =>  .81  ; a 1/4 question gives us 8/10 of a bit
(question-bits .75) =>  .81  ; same answer (of course)
(question-bits .1100278644383595) => .5
If we could only come up with questions that were true about 1/10th of the time, we'd have to play 40 questions. Back to clustering next....
Thursday, June 14, 2007
Pondering about clusters
Wednesday, June 13, 2007
Buckets 'o Spam!
Thursday, June 7, 2007
Domain-specific Languages in Lisp
>
> That said, when I think of a DSL think about letting folks write
> "programs" like:
>
> "trade 100 shares(x) when (time < 20:00) and timingisright()"
>
> When I think about syntax transformation in Lisp I think primarily
> about language features.
In order to talk about domain-specific languages you need a definition of what a language is. Semi-formally, a computer language is a system of syntax and semantics that let you describe a computational process. It is characterised by these features:
- Primitive constructs, provided ab-initio in the language.
- Means of combination to create complex elements from the primitives.
- Means of abstraction to control the resulting complexity.
So a domain-specific language would have primitives that are specific to the domain in question, means of combination that may model the natural combinations in the domain, and means of abstraction that model the natural abstractions in the domain.
To bring this back down to earth, let's consider your `trading language':
"trade 100 shares(x) when (time < 20:00) and timingisright()"
One of the first things I notice about this is that it has some special syntax. There are three approaches to designing programming language syntax. The first is to develop a good understanding of programming language grammars and parsers and then carefully construct a grammar that can be parsed by an LALR(1), or LL(k) parser. The second approach is to `wing it' and make up some ad-hoc syntax involving curly braces, semicolons, and other random punctuation. The third approach is to `punt' and use the parser at hand.
I'm guessing that you took approach number two. That's fine because you aren't actually proposing a language, but rather you are creating a topic of discussion.
I am continually amazed at the fact that many so-called language designers opt for option 2. This leads to strange and bizarre syntax that can be very hard to parse and has ambiguities, `holes' (constructs that *ought* to be expressable but the logical syntax does something different), and `nonsense' (constructs that *are* parseable, but have no logical meaning). Languages such as C++ and Python have these sorts of problems.
Few people choose option 1 for a domain-specific language. It hardly seems worth the effort for a `tiny' language.
Unfortunately, few people choose option 3. Part of the reason is that the parser for the implementation language is not usually separable from the compiler.
For Lisp and Scheme hackers, though, option 3 is a no-brainer. You call `read' and you get back something very close to the AST for your domain specific language. The `drawback' is that your DSL will have a fully parenthesized prefix syntax. Of course Lisp and Scheme hackers don't consider this a drawback at all.
So let's change your DSL slightly to make life easier for us:
 (when (and (< time 20:00)
            (timing-is-right))
     (trade (make-shares 100 x)))
When implementing a DSL, you have several strategies: you could write and interpreter for it, you could compile it to machine code, or you could compile it to a different high-level language. Compiling to machine code is unattractive because it is hard to debug, you have to be concerned with linking, binary formats, stack layouts, etc. etc.
Interpretation is a popular choice, but there is an interesting drawback. Almost all DSLs have generic language features. You probably want integers and strings and vectors. You probably want subroutines and variables. A good chunk of your interpreter will be implementing these generic features and only a small part will be doing the special DSL stuff.
Compiling to a different high-level language has a number of advantages. It is easier to read and debug the compiled code, you can make the `primitives' in your DSL be rather high-level constructs in your target language.
Lisp has a leg up on this process. You can compile your DSL into Lisp and dynamically link it to the running Lisp image. You can `steal' the bulk of the generic part of your DSL from the existing Lisp: DSL variables become Lisp variables. DSL expressions become Lisp expressions where possible. Your `compiler' is mostly the identity function, and a handful of macros cover the rest.
You can use the means of combination and means of abstraction as provided by Lisp. This saves you a lot of work in designing the language, and it saves the user a lot of work in learning your language (*if* he already knows lisp, that is).
The real `lightweight' DSLs in Lisp look just like Lisp. They *are* Lisp. The `middleweight' DSLs do a bit more heavy processing in the macro expansion phase, but are *mostly* lisp. `Heavyweight' DSLs, where the language semantics are quite different from lisp, can nonetheless benefit from Lisp syntax. They'll *look* like Lisp, but act a bit differently (FrTime is a good example).
You might even say that nearly all Lisp programs are `flyweight' DSLs.